Welcome to the TFC Commodity Trading Forum.
Please feel welcome to join in on these informative ongoing discussions about trading futures and commodities.

The Trading Forum is intended for the open discussion of commodities trading. The management of this Forum does not agree or disagree with the ideas exchanged, and does not exert editorial control over the message posted herein. Read and post at your own risk. The risk of loss in trading or commodities can be substantial. We discourage the use of this Forum to promote trading that is acknowledged to be risky. Please note: many links from the Forum lead to pages on other web sites. We cannot take responsibility for nor endorse the information presented on those sites.

TFC Commodity Trading Forum

Re: Stock Market/Duck *PIC*
In Response To: Re: Stock Market/trades ()

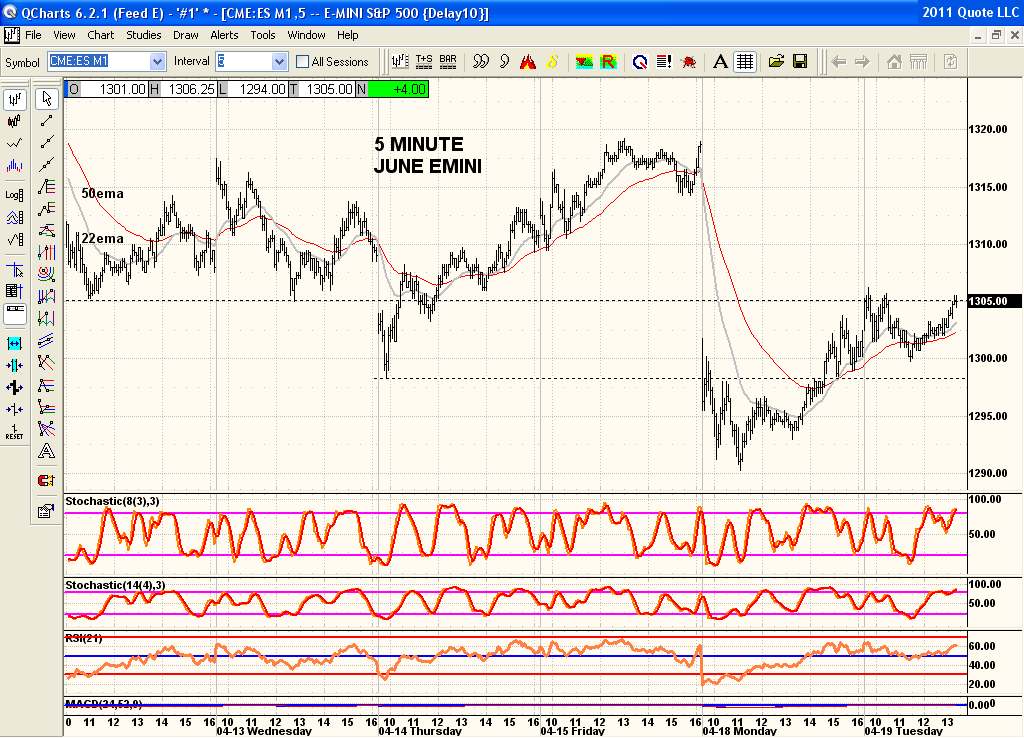
You said a 5 minute chart was needed. There is only 5 days data there which is needed for support and resistance levels to show up so thought you'd need that many days. Also to compare the moving average character too. So how are you using the 1 minute chart you mentioned with this? And still using the 22ema and 50ema cross overs with the 1 minute too?

OR are you just using the moving average cross overs on the '5 minute chart only' to buy quickly once crossed and sell when 1 point is achieved? That's what I didn't get.

Messages In This Thread

Re: Stock Market/Duck *PIC*