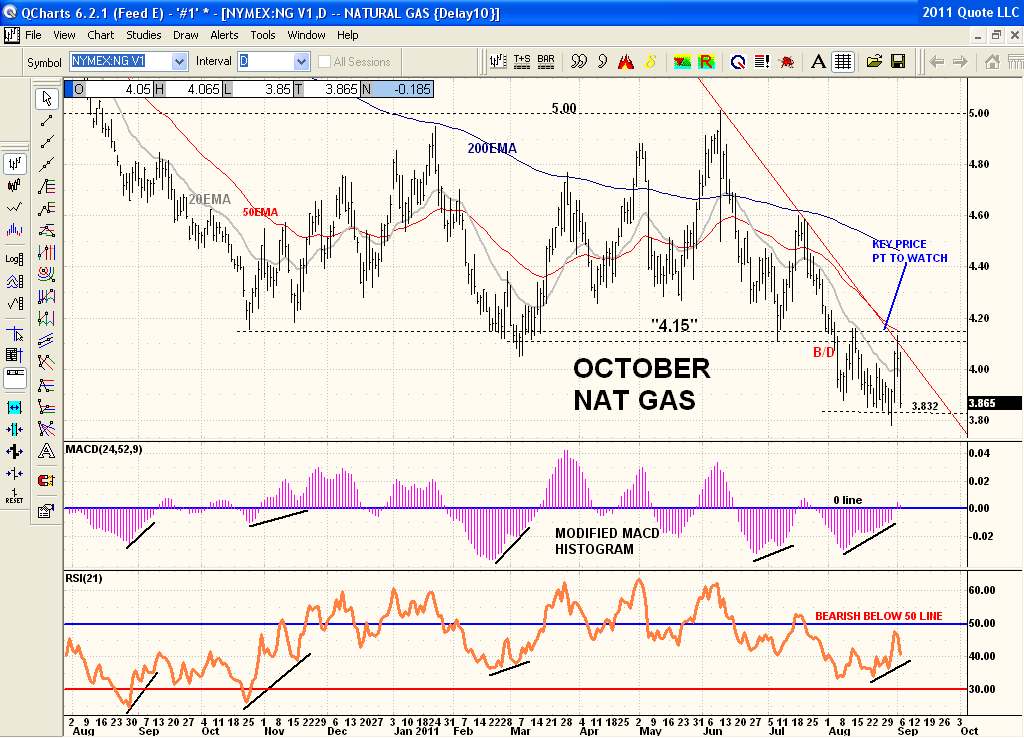
Well all I really go by is the price action on the charts and always keep in mind the seasonal trends in all time frames. The seasonal trends are up from here but so far the technicals have not confirmed a rally. Not unusual as seasonals can be early or late and are much like weather patterns where you can have an early or late spring etc. So what one does is in the positive seasonal time frame is wait for a technical signal. See how the 4.15 resistance AND downtrendline stopped NG in its tracks which is exactly what the chart said it would do. But what is especially notable right now is Thursday and Friday's selloff to a double bottom. Price 'closed' Friday 3 cents off the major low made recently of 3.83. And look at the technicals! See the "Modified MACD Histogram" along with the RSI 21 showing a pronounced positive divergence at this double bottom area which typically suggests a rally from here. You will often see price drop back to a 'double bottom or even new low' much like pushing a beach ball underwater and then letting it go if it is stronger on the 2nd attempt down. I would not be surprised to see price rally back sharply to the 4.15 area and perhaps even breakout there. But it doesn't matter a damn what I think only what the chart is saying. And the chart is saying price now at this double bottom 'area' is stronger than it was on the 3.83 low. And looking at the lower oscillators which are very long in length unlike the standard length oscillators that that often whip saw. This is why I use the longer length oscillators to reduce whipsaws. See the previous Histogram positive divergences on new price lows along with the RSI 21 as well and what happened with price next. No holy grail but has a good track record of success. So yes price could plunge to more new lows with the Histogram and RSI 21 continuing to show positive divergences. It doesn't give a price or the date of the bottom but is a heads up of a likely bounce very soon in time if nothing else.