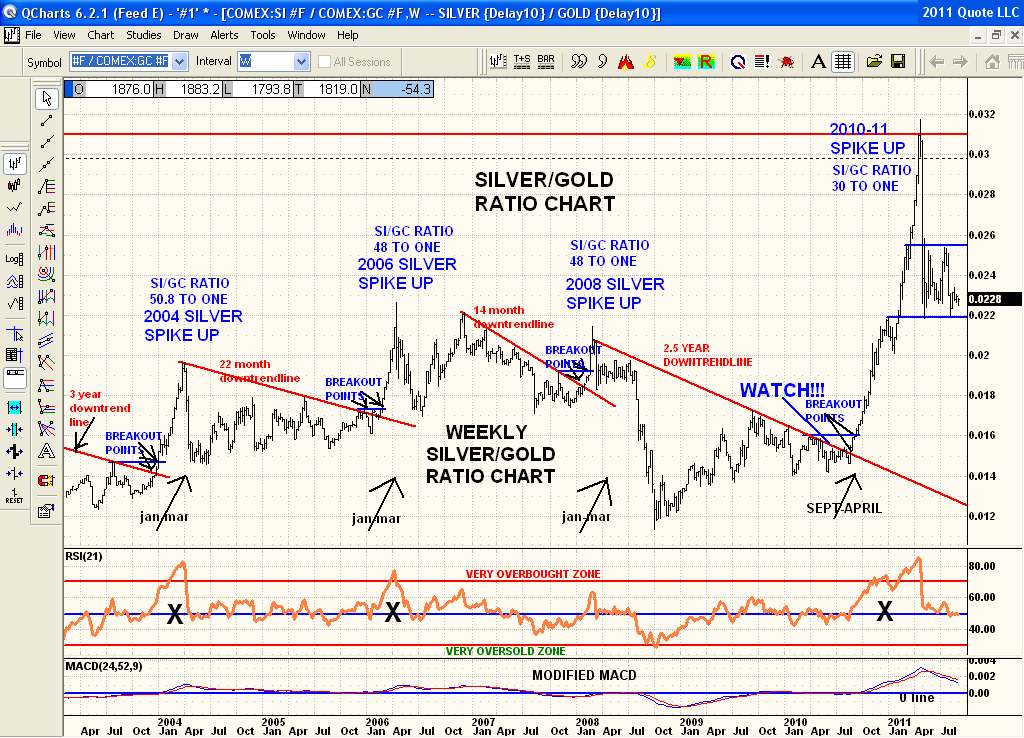
Here is the Weekly Silver/Gold Ratio chart I've posted here for years. Recall June 2010 when I posted it again but saying while every even year the rally starts in the Jan to March time frame it hadn't occurred then by June. That is when I posted this chart with WATCH!!!. And while it was unexpected and seemed like it wasn't going to have an even year rally of signficance it did breakout exactly like all the others did. It 1st breaks out over its downtrendline and then to confirm breaks out over the 1st resistance point. That's what they all do each time and this one wasn't any different. What isn't clear is the "magnitude" of the rally. Notice how brief and sharp previous rallies have been with this 'ratio chart'. No consistency with the depth and length of the rally relative to Gold. So one can get complacent and think it's no big deal again. But while this is a ratio chart the actual Silver chart is much more dramatic in size of rally of course. But this chart has worked well for signals. And as you mentioned the reverse of this chart being the Gold to Silver ratio has been a good guide for the economic climate overall as well. I don't like to look at it as much as it is ass backwards regarding rallies and selloffs so one would have to compare inverse ETFs to see the trades in it.
Been thinking of selling my place for ages now and prices are starting to soften up some. My place here would still sell for about $600k and with clear title I could get off this rock and buy a place on the East Coast with a nice trading account left over. Perhaps I could even have a hot chick as a 'travel companion' too,lol. And when those East Coast winters come I could simply go south for the winter like all the other Snow Birds in Canada do. Sounds like the right ticket..................