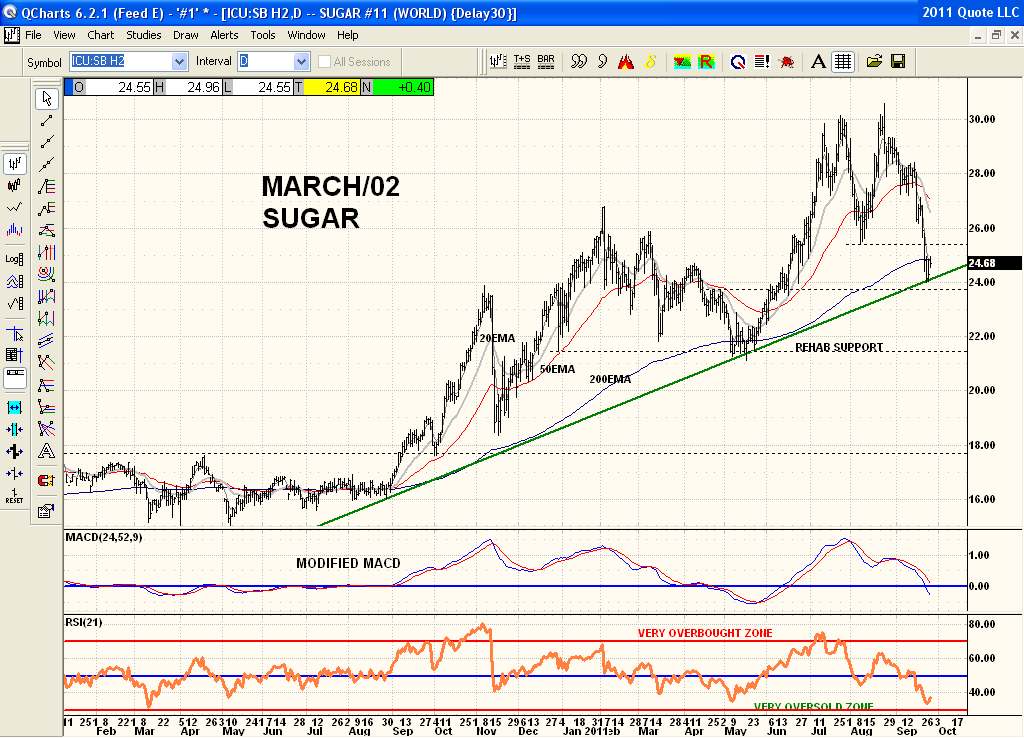
Thanks CO. The upper line on last night's Sugar chart (Coffee post) was just the Fib tool line showing the Fib retraces back down for further areas of support to watch for and not an support or resistance line. And yes there is typically a bounce off a long term uptrendline like you are seeing this morning. And the 200ema is also serving as support at this same area as well for a little more strength at support. So far nice bounce this morning. But I'm not especially bullish this pattern as the August lows have clearly broken down without even a pause there. Not a good sign for sure. But a chart is a chart and support is support and price is bouncing off support.......so far................. Not a postion to marry for sure but a tradable one. As far as commercials go I've always found with their very deep pockets that they will get short and stay short and add to shorts all the way up with a rally without much concern and have never found that data useful other than at a yearly high or yearly low which is a heads up for change. Very few could ever follow in their footsteps financially. So the short position in August by them with the big rally doesn't surprise me the way they trade. I recall years ago with Crude at $10 a barrel they were short and very short all the way up to well over $20 a barrel which is over a doublling in price and traders trying to trade with that info got their heads handed to them. That always stuck in the back of my mind when looking at C.O.T. so don't follow it anymore. But there is much more to the overall data than just a glance at their overall short positions and Open Interest. I used to subscribe to Software North and found when the O.I. line dropped off sharply with strong rising prices that was a tip off of a price high nearby. But that was just my observations and nothing too scientific.