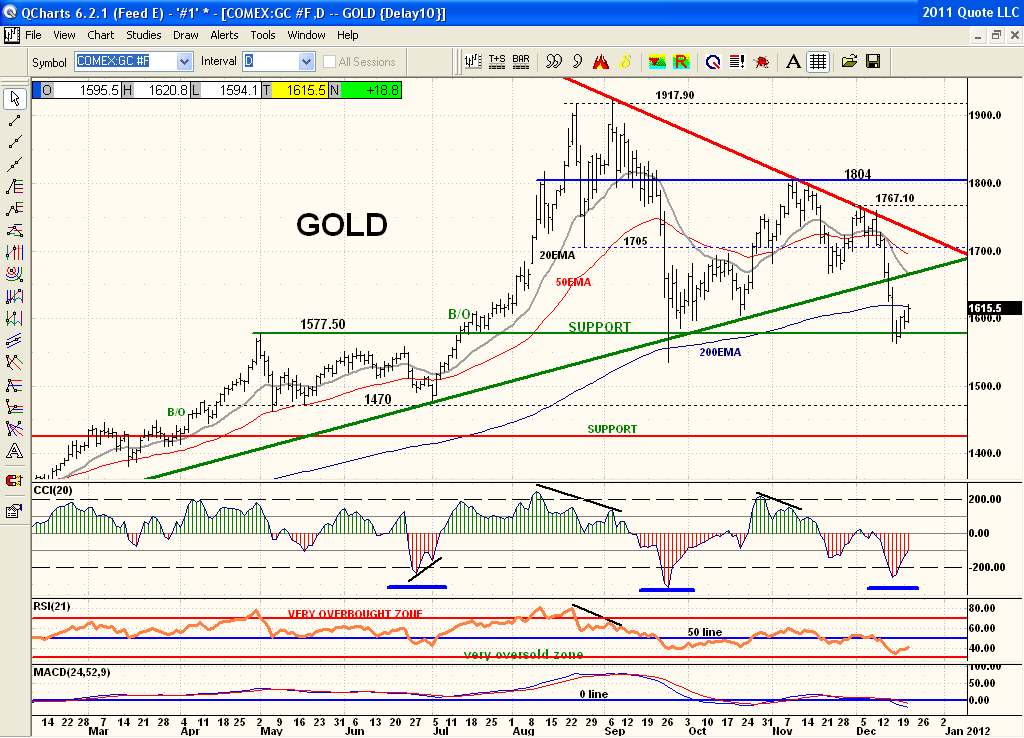
Here is the same chart I've posted recently a few times. Strong support is the breakout point at $1577 that has been successfully tested in Sept. That is also where price has come back to once again. It is also its 200ema area that price has not gone and stayed below for years. This price area must hold or Gold could be in for a lot more selling. The strong support here suggests a "bounce" which it is trying to do. And if you look at the CCI 20 indicator below you can see when it falls below -200 (dashed lines) price is very oversold and is due for a bounce back. One must not jump the gun with this indicator as price can easily have a couple of selloffs and plunge on any one of them at this point with this oscillator just forming a "W" pattern with price much lower before it snaps back. Best to wait for the oscillator to cross -100 1st and better yet to cross above the 0 line to confirm the low is in. And of course even then have a stop below that day's low or whatever your risk level may be. I'd be more convinced a price low was in if there was a postive divergence on this CCI 20 oscillator like it had on the early July price low. And with the price action from the breakout of $1577 in July you can also see the entire price action since then could simply be just an incomplete Rectangle between $1577 and $1917 and price could simply stay in this range for months.
Putting on the Bear glasses you can see the breakdown of the Symmetrical Triangle which suggests a lot more downside. Also with this flat bottom at $1577 tagged once again along with the downtrendline above this forms a bearish Declining Triangle as well with similar downside projections. So while strong price support at $1577 along with a very oversold oscillator suggests at least a 'bounce' right here it just might not have the legs to run it up very high before it comes tumbling down again. This is what the chart is telling me. I personally haven't a freakin' clue as the financial world is being run by a bunch of narcissistic political sociopaths.