I used an old rule set I don't normally trade.
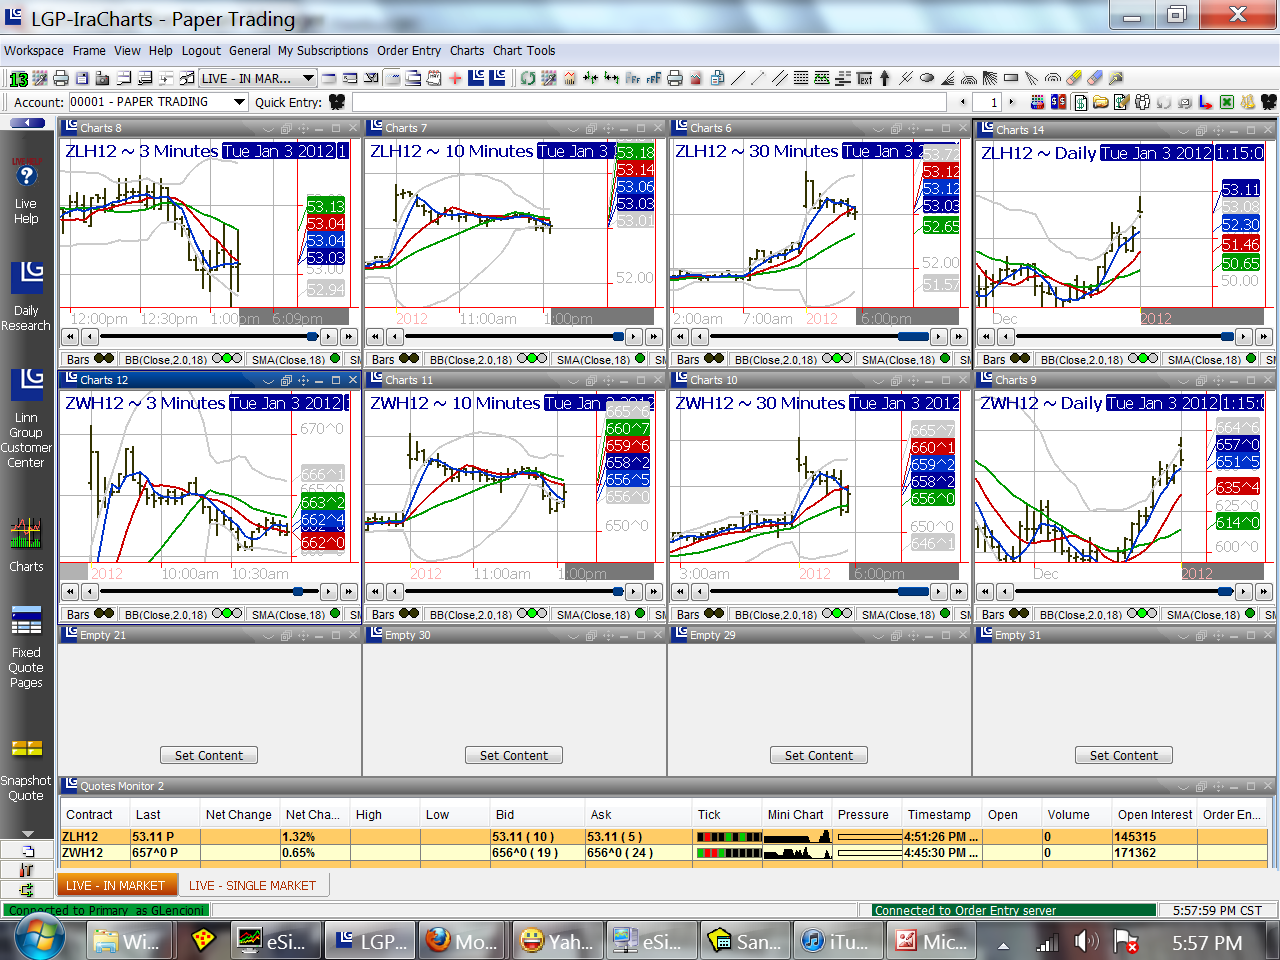
First trade was right on the open. However, my rules state that when there is a large gap, between the open of a bar, and the bollinger band, that it will seek to fill that gap. The daily chart opened right on the bollinger band, which is a signal in the opposite direction (bullish) That is the signal I took originally.
However, as soon as I was in, the gravity of violating my system set in and I got skiddish, so i got out. This had to do with the second bar on the 3 minute chart also opening well above the bollinger band. The whole start of the day was a cluster f#@k, and reflects a psychological issue I have yet to beat 100%.
After beating myself up over that blunder, I took a little break and did some Kung fu forms to wake my up a bit. and rest myself.
Now, on to the actual trades. With my mind reset, I started looking at my charts again and saw what is known as a 'Key Reversal' on the opening bar of both the 10 minute, and 30 minute chart. In conventional thinking, you can enter off of these and do contrarian trades. I normally use them as exit signals for the most part. I exit long positions when I see them appear above a bull trend, or exit short positions if they appear below the trend rather than use them as signals to enter counter to the trend, because they are only accurate about half the time.
In this case, because it opened so far above the bollinger bands, my experience has told me that in all likely hood this would perform very well, so i took the short.
The trade did not go as expected, and was rather choppy. At one point I almost got out and was ready to chalk up a loss. I stayed in because there was growing divergence between the upper bollinger band, and the 4 bar moving average. To me this is an early sign of a price correction. Normally I exit positions on these, but since I was already in, in the other direction I used that as a cue to hold on. It paid off and I exited somewhere below when I started to get skiddish again. Later, I decided I was being over cautious and sold a second time on the next opportunity.
I used what I call a Spear Point trade to accomplish this.
Here are those two trades as they played out
1/3/12 11:54 SELL 1 @WH2 661 3/4 12:45 659 1/4 n/a $111
1/3/12 10:54 SELL 1 @WH2 665 11:43 662 2/4 n/a $111
Commission is $14 round turn.
The time stamps are of the trade exit.
The exit on the second one was rule based, using the rule that any extreme move beyond the bollinger band will be subject to the rubber band effect. I like to get out while the 'Rubber Band' is still stretched, and get back in after it is done correcting. They helps me exit as close to the end of the move as possible.
I have 5, or 6 dedicated, high probability set ups I watch for, in all time frames, in all markets. The system is fractal, so they are used the same way in every size scale. The set up today was not one of them however, but an old set up I used to use years ago. I dropped it for the most part, because it's not as reliable as other ones. I have a ton of setups like this in my head, that I do, on occasion break out of retirement and use if the conditions for them seem ultra perfect.
I choose markets with the weekly, and daily charts, and time entries with the 3 minute, 10 minute, and 30 minute charts for day trades.
For longer trades where I will be in over night, I choose my markets with the monthly, and weekly charts, and time the entries with the daily, 8 hour and 30 or 60 minute chart. I am still way under margined for this right now though so I rarely do anything but day trade. That, and I am just not comfortable leaving the computer unattended when I have money exposed to the markets..