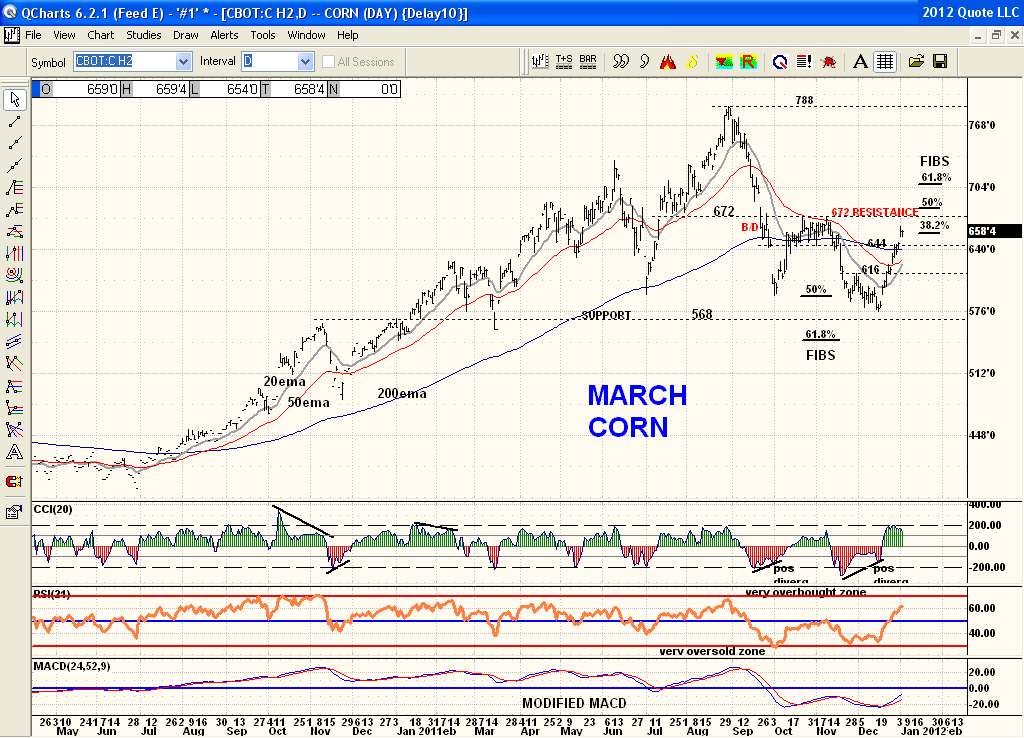
March Corn gaped up over 644 resistance and has held the last 2 days and is approaching more significant resistance at 672. That is the Oct and Nov highs. Price has retraced Fib 38.2% of its Aug to Dec selloff. Price is now in a narrow trading range between 644 to 672 with an overbought CCI 20 indicator and could stay in this range for awhile and consolidate. . Staying above the 20ema will turn the major moving averages bullish again. Watch for a breakout over 672 or breakdown of 644 to determine the next sizable move.