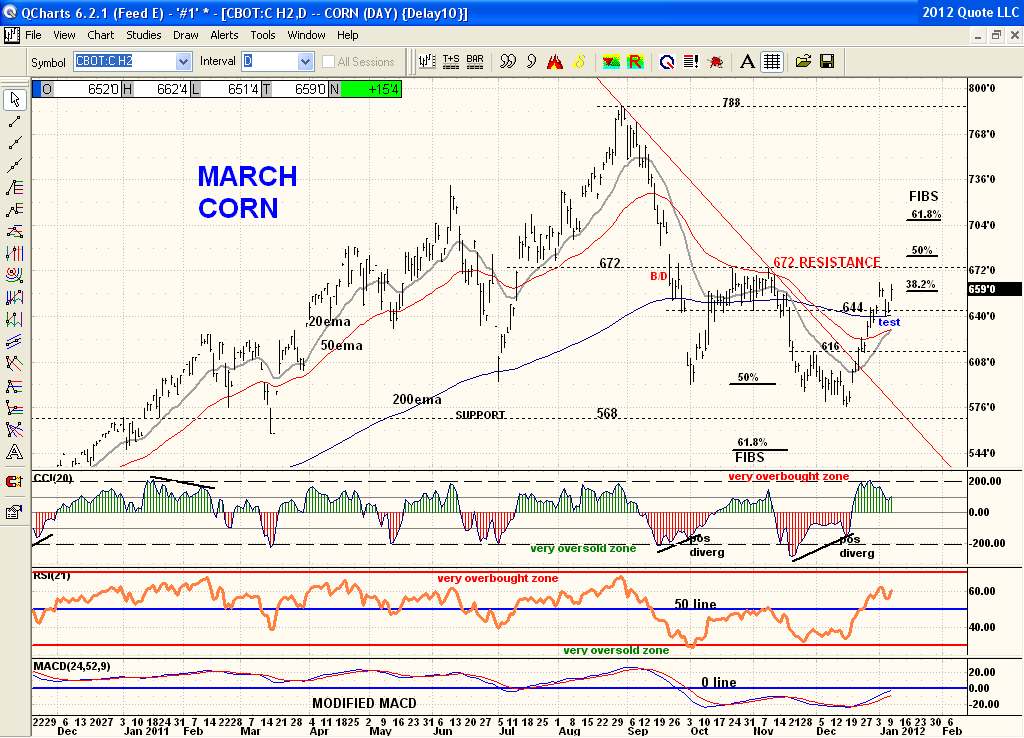
Here is a chart of March Corn again. Price recently cleared 644 price resistance and came back to test this price point as support. So far the test has been successful. Doesn't change anything. Price is still trapped between the 644 breakout/support price and the Oct/Nov high price resistance of 672. And a breakout or breakdown of either will determine next strong direction. Meanwhile as long as price remains in this tight channel the moving averages continue to rise turning them more bullish. A rising 20ema above a rising 50ema above a rising 200ema would be the most positive position for them to be in. This would also see the postive Modified MACD cross above the 0 line as well. The breakout over the Aug to Dec downtrendline that retraced a Fib 50% of the selloff was bullish. But price has more work to do to suggest more on the upside and to improve the technicals. Price has now retraced a Fib 38.2% of the selloff reaching overbought areas and could typically track sideways here for awhile. Bottom line: watch for a breakout or breakdown of 672 or 644.