Well the ass holes of the world that offer nothing and grandstand like a spoiled brat wanting attention does get to me. And I'm not a good Canadian that tolerates too much. Just not cool and collected like most here so can punch below the belt and fight dirty. I'd just as soon put a bounty on them and hunt them down. The less of them out there the better. See them all the time in every aspect of life. I prefer to deal with them face to face and have found the tone changes then considerably when their ass is on the line. Always easy to talk the talk on a computer or other distant method. But I just don't click on their posts here when they offer nothing but stupidity and sarcasm. Not much point really. Just click on Search and pick half a dozen posts of theirs and see what value there was in any of them. That will answer the question of whether it's worth reading their posts.
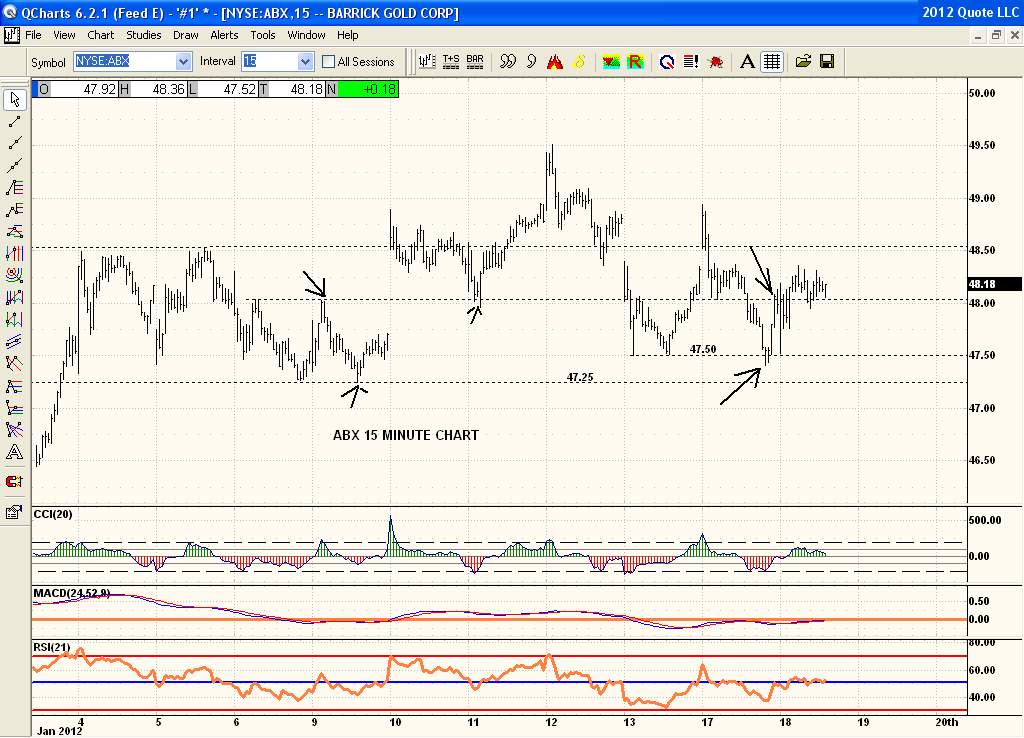
As far as Ross Clark goes I do agree with his recent comments on resistance being the 1650-1670 area. That is right on the Nov low I've marked on the Gold chart and next resistance since clearing 1625.He claims this price rally high area is due right now from Jan 17th to 20th. So we are on the same page there. But the chart tells the story and clearing and holding above the downtrendline or breaking back below 1625 will determine the next significant direction from what the chart suggests. He also claimed price would selloff only down to the 1570 range and then rocket up to new highs after that. A lot of indicators are in the overbought zone presently and while price can continue up regardless that is not where I get long. Meanwhile I'll just trade the intraday channels. Caught a late day rally yesterday on ABX. It sold off with a downgrade from some brokerage firm too. Look at this15 minute chart and see the test of the Friday low at 47.50 and bounce up to 48 again. There were others before that as well as usual. Oddly enough most traders talk about early morning trading and going home after lunch type of thing. I've always only sold in the 1st 1/2 hr to exit a postion but prefer to see these channels develop during the day. I wish the day never ended often as those afternoon trades can be excellent trading channels or tests of support or resistance. By then some channels are very well defined. Then unless there is a defined trend I exit by end of day. Sometimes right at the bell. Right now price is trying to hold at 48 short term support.