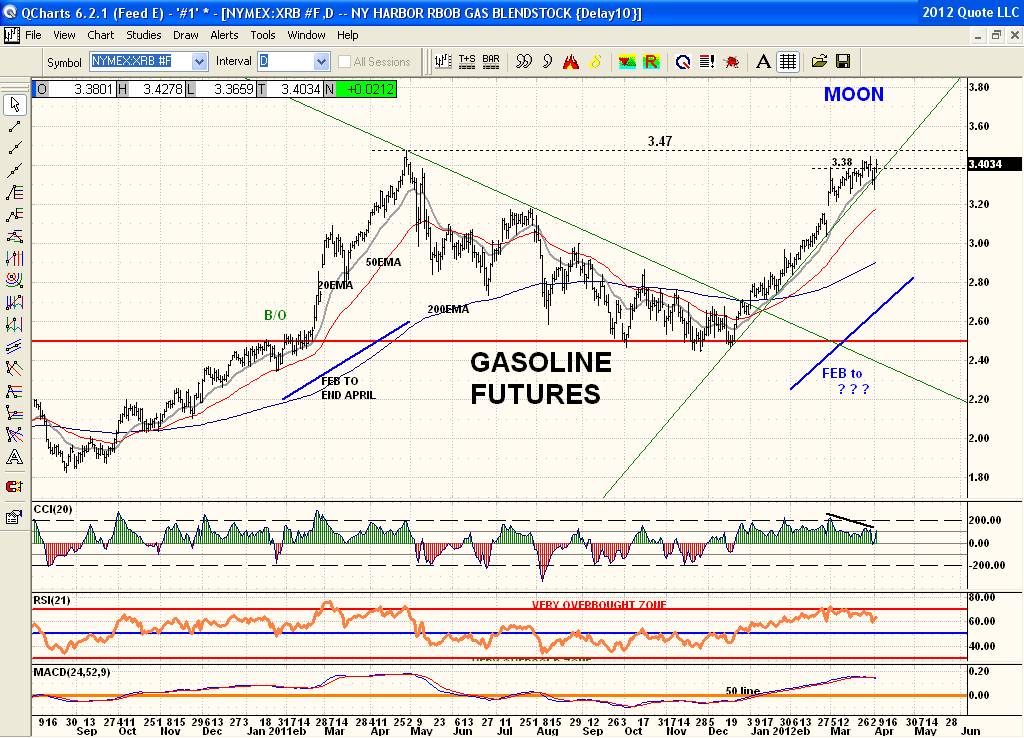
This is the chart that we need to see breakdown. So far price is still hanging in there in its yearly rally mode pattern. Gotta see price breakdown on this chart to be out of the woods and see a turn south in this market. See how quickly it bounced off its uptrendline. But it has also lost its bullish momentum as well spinning its wheels at this $3.38 resistance area for some time now. Note the CCI 20 showing a loss of momentum and a negative divergence showing.