Please find enclosed herewith the Coffee trend forecast for the month of December 2016
It is very easy to read these forecast graphs.
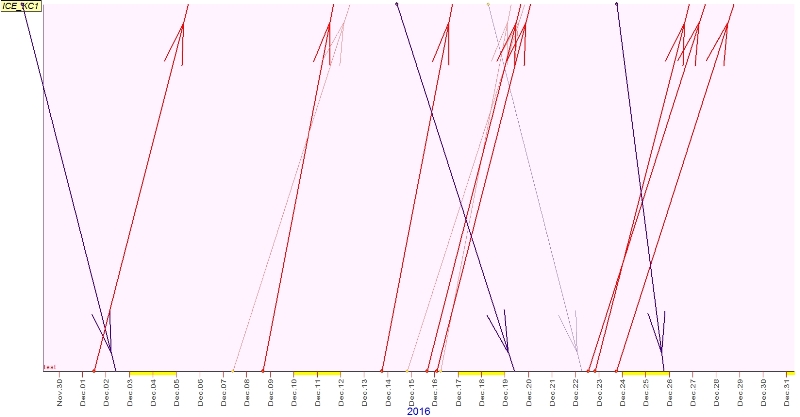
In the enclosed graph you can see lot of red arrows and blue arrows.
red arrows indicate uptrend
blue arrows indicate downtrend.
intersection of red and blue arrows indicate dual trend.
Thick arrows are more powerful & accurate than the thin arrows
All dates and time are as per newyork local time
Calculations are based on Cycle,Geometry,Astronomy & Ancient Mathematics
In last seventeen years of my carrier i have not seen anything as powerful as these arrows.
I can tell you with confidence that this is the best thing you can have to know the future trend of any financial market with unbelievable accuracy
Please do not expect 100% accuracy (though surprisingly they are as good as 100%)
With best wishes
"SA" MARKET FORECASTER
www.stock-commodity-forecasting.com