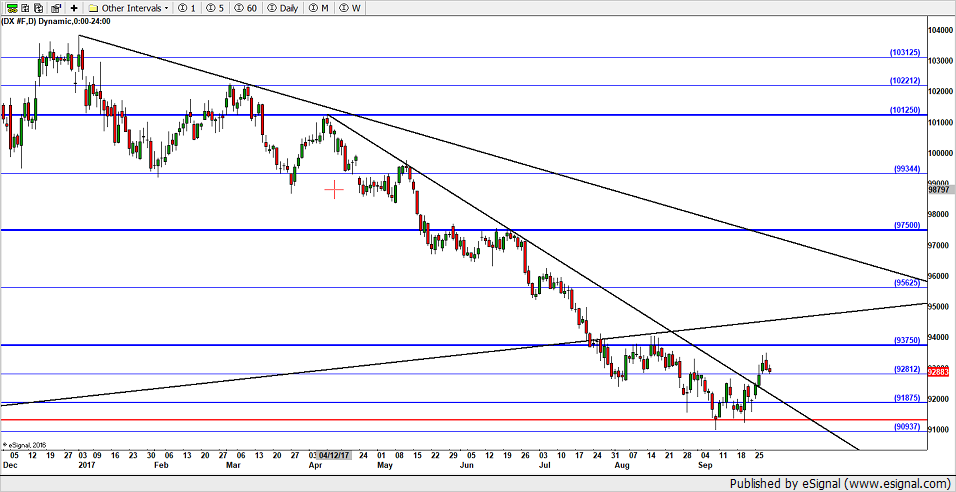
Re: DX... *PIC*
Daily...price broke above the downtrend from 101.25...the day before the break was 120 days from the 101.25 high and 188 days from the 103.125 high. Would like to see something that resembled a test of the break of that line and then resumption of up. If price breaks back below the downtrend line then down to 90 most likely where we will see if the mighty 90 holds. If up on Monday then may make a run to get to or above the 93.75 line by Tuesday or Wednesday for a 52.5 time cycle below the 93.75.
As I say...just good places to look for changes in the pattern. Time from highs...time from lows...time below and above these geometric price demarcation points.
I could go through and show where price turns on or around the same places in time and price but it would make for an awkward list of numbers...worse than it already is!
It's still a "time will tell" thing, but at least it gives and idea of when and where to look for changes.