Re: DOW... *PIC*
Well...that's where the thinking of both time and price as being degrees instead of price and time comes in. X number of degrees up by X number of degrees time.
On this chart...from 9000 to 12000 is 3000 dollars. For time to balance out with 3000 dollars it would take 3000 months at a dollar a month. Right. That's one flat looking 1x1 and is of no consequence to the chart for a very, very long time or one hell of a crash in price.
Gann adjusted his charts, on some commodities, by using 20 or 30 cents per day...eggs, chickens, cotton...something...I can't remember what.
I contend that one can achieve the same results by considering 3...30...300...3000...30000 to all be the same. It's just 3. We are, after all, dealing with a man made concept when dealing with money. It has no real meaning...so whack off a few zero's and consider the demarcations on the price scale to be 90, 120, 150, 180 degrees or increments of 30...30 degrees. Doesn't matter unless you're trying to buy a 30,000 dollar car with 3 thousand dollars.
If you consider 3000 dollar move in 30 months(3000/30) equals 100 dollars a month move.
That's not in the most technical sense of the word a 1x1. It is a derivative of the 1x1. It is derived by compressing the price on the chart by a factors of 10. It makes a line that is more applicable to the chart at this time.
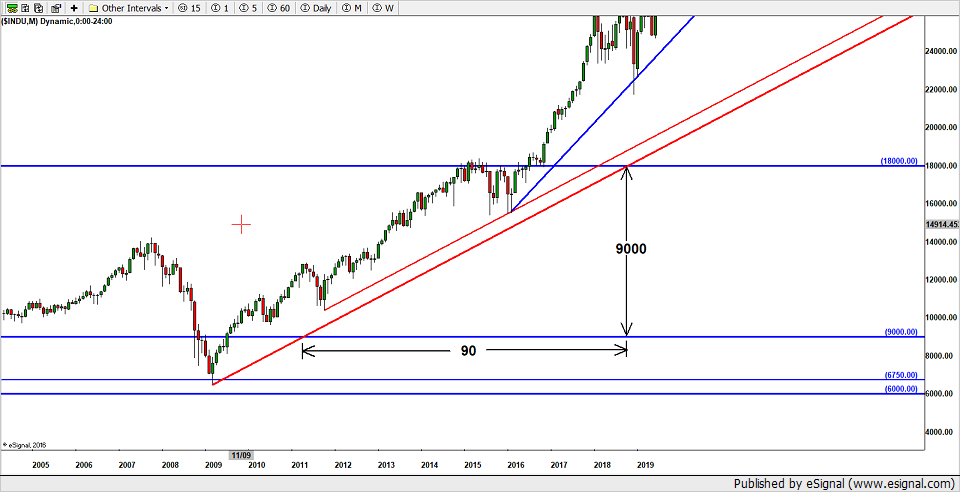
Look at this chart where price has moved up from 9k to 18k in 90 months as depicted by the red trendline. from 9k to 18k is a 9k move. a 9k move in 90 moths. 9000/90=100. If you lop off all the zero's...you got 9/9=1.
If you wanted to...you could do penny's...9k dollars=90,000 cents. 90,000/90=10000 pennies per month.
1 dollar...a hundred pennies...what's the diff...it's all just 1.
So the red line on this chart is a 100x1...could be just as easily a 10000 penny x1...it's a 1x1.
Does that make any sense the way I described it? I've about confused myself. hahaha!!!