Well the 20ema is very important with price above in uptrends and below in downtrends as a rule. Twenty trading days is actually 28 calender days. Do any research on 28 calender days and you'll see many natural cycles in that time frame. Ask any woman about 28 calender days and she'll tell you about that cycle for all of them. One could argue then it should be 20sma not 20ema. But moving averages with price lag and simply removing the price of 20 days ago and adding today's price lags considerably. I've overlaid both in all time frames for years and there is no question that ema moving averages are far superior than sma. A good example is to put on a 50sma or 100sma or 200sma and overlay the chart with the same numbers in ema. What you'll see is when prices change direction the sma moving averages keep right on running in the old trend direction for not only days but often weeks before they finally feel the effect of recent price action and change directions as well. The ema moving averages will change quickly with recent price change in direction but still track the sma moving average of that same time frame overall. That's just the way it works due to the lag of sma moving averages. Some things need to be calculated in pure form of actual trading days but price on a chart isn't one of those ways. The ema moving averages are front weighted and pick up on the natural lag but still track that time frame.
So I always have the 20ema on any chart and you'll see price track it above in uptrends and below in downtrends. Note NG running up to the 20ema and then selling off each time hitting it like a concrete ceiling. And it isn't even actual price resistance from previous trading prices. So it is impressive for trading off a chart. Keep in mind with sideways price action any moving average or anything made up with moving averages such as MACD etc do not work well and price will just whipsaw through them above and below until a trend develops. You need to watch the moving average line for when it goes sideways and not bet on it for direction until it turns back up or back down and trends again. No holy grail.
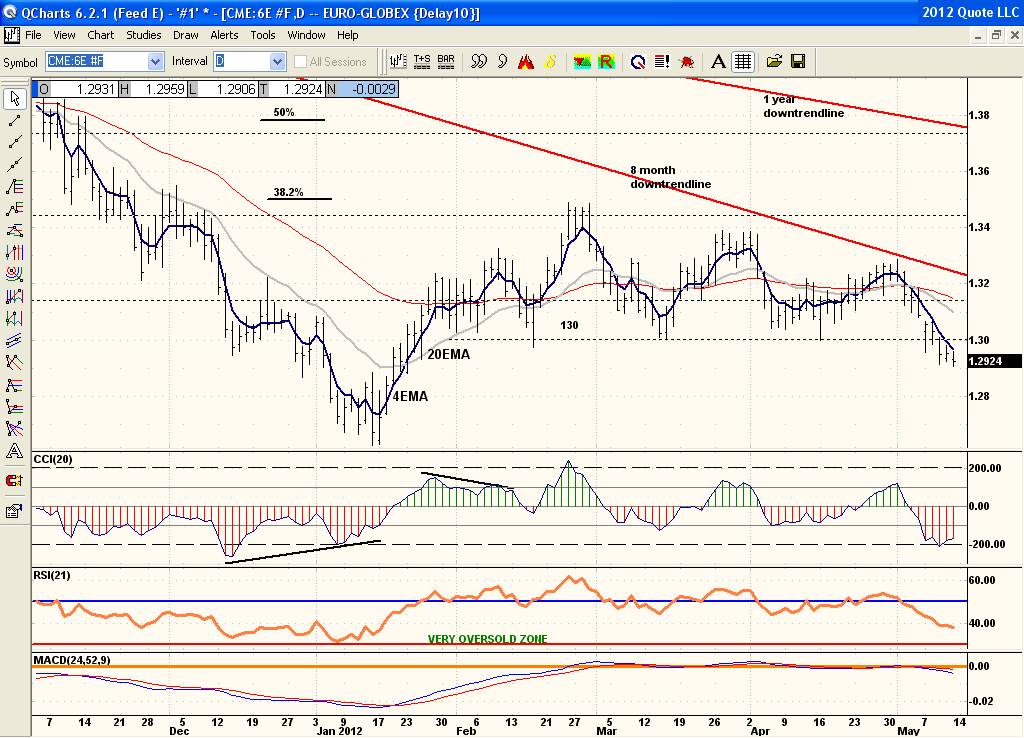
As far as the 4 ema goes when price is above the 4ema will see price 'close' above the 4ema in uptrends or 'close' below the 4ema in downtrends 'consistently'. You can have one close over the 4ema that is counter trend that is only a warning but two in a row means the trend has changed direction. So as long as price 'closes' above the 4ema in an uptrend or 'close' below the 4ema in a downtrend then all is well with the trend you are trading. Again no holy grail but check out some charts with it on to see the character of this 4ema and price to see. It's the close that's important. And again you do see one close counter trend now and again but two in a row tells you to expect a change in trend short term. And it is a short term warning because you are using a 4ema that is only tracking the very short term trend. I have used this in all time frames and it does work about the same but as you know the shorter the time frame the less valid the signals using any indicator. And don't be watching the 4ema crossing above or below the 20ema as it doesn't mean much. That is not what this is about. Here is the Euro with the 4ema and 20ema. This is a bad example as price is in a sideways trend. But I'm not going to cherry pick a perfect example just to make the point. It is what it is. But even in this sideways price action of the Euro you can see price closing above the 4ema or closing below the 4ema with each "swing" up and down. But as I said check out a bunch of charts closely to see. With the daily chart the most important thing to watch is price either trading above a rising 20ema or below a falling 20ema. This will determine the medium tradable trend in a market. Then to be safe you would only take trades using the 4ema in the direction of that medium term trend of the price to the 20ema. That would be the safest way to trade it. See the downtrend respecting the fallling 20ema well into January. That is what a trend should look like. Since Jan the Euro has been trading in a sideways pattern and not easy to trade. Look for charts in defined uptrends or downtrends using the 20ema as support or resistance as they are the best trading markets. Then you can use the price closes with the 4ema for trading in that direction.